In this article series I will go into detail about resource usage of PVS servers. In the first part I described the theory values Citrix is using/advising for the components CPU, Memory, Disk and Network. Also physical versus virtual is touched briefly. The article series will continue with taking a look at the real life resource usage of PVS servers. In this part we will take a look at the resource usage during daily operations.
Community Effort
I started this article series because one of my customers asked me to verify if our design was correct (they doubt the resource capacity was sufficient) and the network department would like to know the real bandwidth usage of the PVS infrastructure. While I was running these test I thought it’s was interested enough to write an article about it. But I did not have the environment up and running yet with production users, so I can only execute the boot scenarios. So I asked the community if they were willing to share figures of their PVS infrastructure. Quickly three people already responded, that’s why I really like the virtualization community a lot. Logically those guys deserve a big applause and thank you from my site. Thanks go to Kees Baggerman, Erik Bakker and Tim Riegler.
Real Life Scenario 1 (provided by Kees Baggerman)
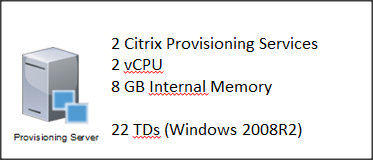
The environment provided by Kees Baggerman is nog a real big environment existing of 22 Windows 2008 R2 Target Devices. Therefore the PVS servers resources provided are based on that starting point, 2 vCPU and 8 GB internal memory.
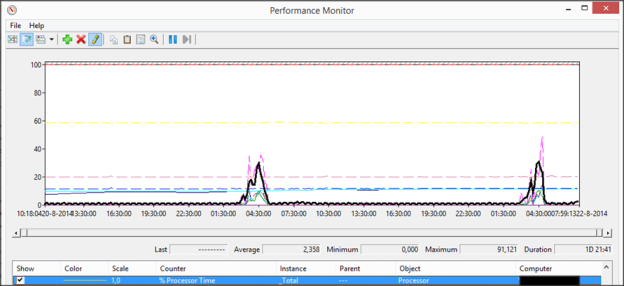
I will start looking at the CPU usage. Taking a look at the collected data we see that the CPU can easily handle the load. There is a spike at 4:30 in the morning (at this time the target devices are restarted), but this peak around 30/35% is no problem at all
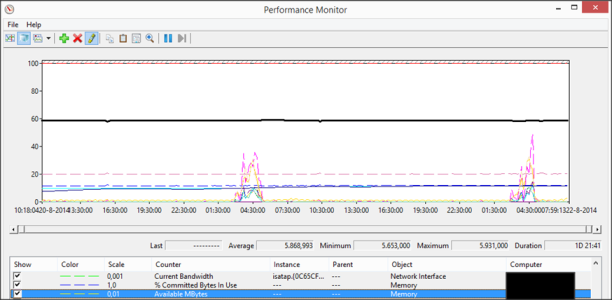
The PVS servers are provided with 8 GB internal memory that could be seen as limited. However when we take a look at the counter available memory we see that there is no additional memory usage and almost 6 GB memory is available.
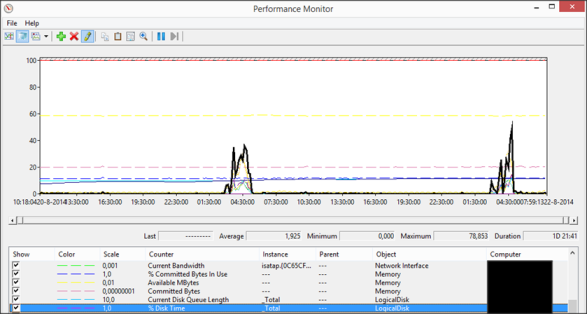
Next topic is the usage of the disk. During the operational hours the disk time is really low; however we are seeing a peak at the %DiskTime when the Target Devices are restarted. That was not what I expected, because that part should already available in memory based on the Large System Cache option of 64bit Operating Systems. Unfortunate Kees will not visit this infrastructure anymore to do more research on this. However there is almost no disk queue length, so there is not directly an issue in this environment.
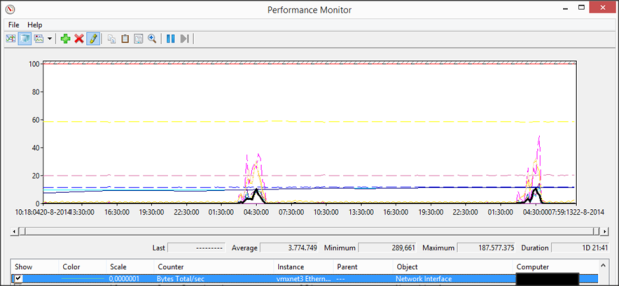
Taking a look at the network usage of the NIC of the PVS server the bandwidth usage is limited. Again at the reboot time a peak is seen. This peak is around 1431 Mbit/1,39Gbit, the average usage is just 28 Mbit.
Real Life Scenario 2 (provided by Erik Bakker)
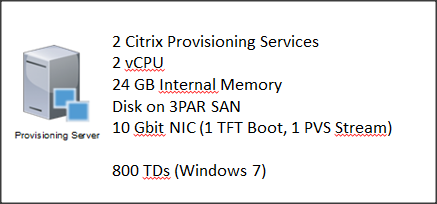
The environment also of 2 PVS servers with 2 vCPUs, 24 GB Internal memory, disk on a 3PAR SAN and two 10GB NICS (one for TFTP Boot and one for the PVS Stream) running on Hyper-V. The PVS servers handles 800 Windows 7 Target Devices (VDI). The target devices is always running, when a user logs off the target devices is restarted (non-persisent) so it’s up and running waiting for another usage. Target Devices which is not used by a user for 8 hours will also be restarted.
First take a look at the CPU usage. At his environment has more Target Devices that are also probably restarted regularly the CPU is more used than our first real life scenario, but with an average of 5% and “peaks” of 20% there is no resource issue at all.
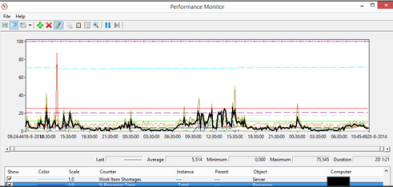
With 24 GB the PVS servers are equipped with a decent amount of memory. This can also be seen when taking a look at the available memory. Just as in the first case we don’t see a big difference in memory usage overtime, again a steady line. Roughly the available memory is between 16 till 17GB.
Just as the first real life case we see some disk usage over the time. This is seen during the production hours. In this environment this is explicable as Windows 7 is being used and specific new content is streamed to the Target Devices. With a peaks around 20% on Disk Time and almost no disk queue length it will not cause any performance issues.
The last component is the network. This environment is using two NICs, one NIC for the TFTP part and the second NIC for the actual PVS streaming traffic. Taking a look at the TFTP NIC, the peak was on the server a bit higher than the other, but a peak of 217 Mbit on this card is not a lot of traffic. The NIC used for the PVS streaming has a peak around 1,7 Gbit, with an low average of 28 Mbit.
Real Life Scenario 3 (provided by Tim Riegler)
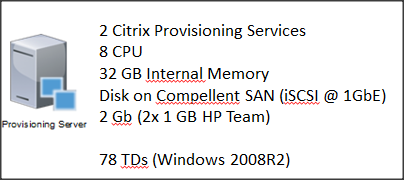
The last real life scenario is provided by Tim Riegler. Also this environment is based on 2 PVS servers. Different with the others is that these servers are physical machines. Probably because it’s a physical servers, the resources are pretty large. We have 8 CPUs and 32 GB Memory. The disks are located on a Compellent SAN connected via 1 Gbit iSCSI. Two 1 GB NICs are teamed, so together there is 2 GB available bandwidth. Several vDisks are used based on different version of XenApp, which are assigned to a total of 78 Target Devices.
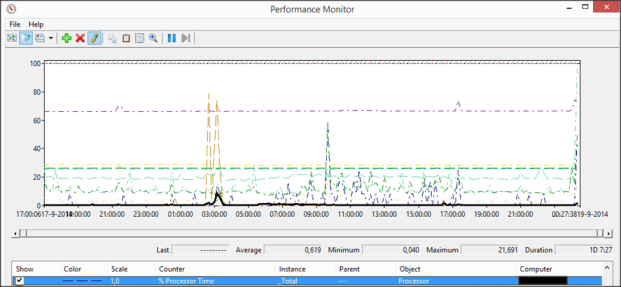
The CPU activity is really low on these severs. The average CPU usage is less than 1%; one small peak of around 10% is shown. The same can be said about the memory. Like the other scenarios we don’t see much difference in the available memory during the time; around 27/28GB is available.
It going to be a bit boring, just like the other real life scenarios we see some disk usage spikes. Again the % is not really high (again between 10% to 20%).
Determine the network bandwidth is sum up the two NICs together. Both NICs are using handling 500 Mbit traffic, together around 1 Gbit. The average has the lowest value of all scenarios 5 Mbit.
Results versus Theory
We discussed three real life PVS environments on resource usage in this part, in part 1 I described the Citrix theory. Let’s compare the actual values with the theory.
In the theory Citrix said two CPUs should be sufficient for servers with 500 Target Devices. The Real Life scenarios underwrites this, all three scenarios have a real low CPU usage (with 2 CPUs). So the theory about CPUs is proven in practices.
It’s striking that all three environments still have disk activity, especially in the Real Life 1 scenario, where we see this activity during the reboot phase (which actually loads data which is earlier streamed). All environments still have enough memory available; unfortunate I did not find a way to do check what the Large System Cache is doing actually.
Last component is network. We are seeing peaks of 1 Gbit to 2 Gbit at the three scenarios. So the advice to use 10Gbit network is accurate, because you want to handle the peak without issues. For the average values a 1 Gbit network is sufficient as well, but the peak could be problematic to handle.
Summarization
In this article series I will go into detail about resource usage of PVS servers. In this second part I described three real life scenarios and compares the results with the theory values Citrix is using/advising for the components CPU, Memory, Disk and Network. In upcoming part 3 article I will discuss the figures based on boot (storm) scenarios.