In larger infrastructures there is already a monitor product available like HP Open View, Tivoli Monitoring and Microsoft System Operations Manager. Many Citrix administrators have a kind of love-hate relationship with such products. They provide lots of interesting information, but can be overwhelming and last but not least the required agent is not easy to install and/or stable. At one of my project the monitoring team was not confident that the agent of that product was suitable to install on the Citrix XenApp Session Host as those were provided by Citrix Provisioning Services (PVS). Logically we would like to have monitoring of these servers in place, so we needed to find a solution which can be used together with the monitor product. Finally the solution leads to a general way to monitor Citrix XenApp server without installing a monitor agent on the Citrix XenApp Session Host.
Introduction
As already stated the monitoring team did not feel confident that the installation of the agent was possible with the PVS concepts into mind. Probably it could be done, but as the team does not have faith I decided that we need to find another way to monitor the XenApp Session Host. After discussing the possibilities, challenges and which kind of information the customer would like to see monitored (and alerted, which was the main goal) we found out that because of the amount of hosts (around 1500) we will deliver that running scripts (using Remote Administration, WMI or something similar) from one machine to other machines was not the way to go because of the load on that server. I also quickly found out that some of the tests I had in mind (the Citrix Health Monitoring and Recovery) could not easily run from a remote machine. I came to four main components that should be monitored and searched for a solution for every component.
System Metrics
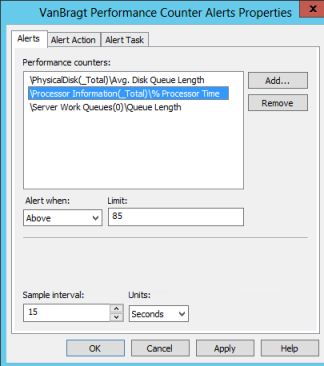
One of the main monitoring components are the system resources like CPU, Memory, Disk and so on. Most monitoring products are using the system counters. These counters can be queried via several methods. The most easy solution is using SNMP from the monitor product to query that on the XenApp Session Host. However the product should supported this (there are products that are totally build around this concept like IPMonitor from SolarWinds). Also products that can run WMI queries can be used for that. A third solution which is nowadays a good option is using the monitor agent which runs on the underlaying hypervisor. Logically the hypervisor layer is gathering a lot about resource usage of the virtual machines and for most environments this information should satisfy the needs. The last option which could be considered is using Performance Monitor. Within Performance Monitor you can create a Data Collector Set based on performance counters alert. Within this set you select the system metrics and at which level you would like that an alert is generated. The alerts can be send to the event log (more about the possibilities of the event log later on) or start a program/script. If the product has a single executable to create messages within the tool, this can be used or SNMP executable to create and send a SNMP trap.
In this situation we have chosen to use the hypervisor layer as this was already in place, so no adjustments need to have to be made in the infrastructure. However another situation could lead to another method to monitor system metrics.
Services
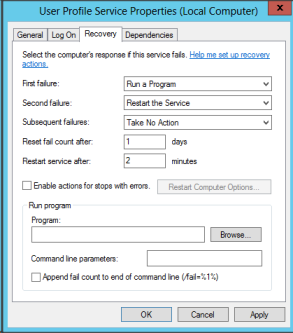
Secondly many IT departments are monitoring services on a server. Actually this is already a poor man’s solution as a running service does not guarantee that the functionally provided by the service is working as expected. However in several situations this is the only way to check on the functionality. Again some products support his using SNMP to check the service via the monitor product back-end. If this is not the case another possibility is to configure a program/script to run when the service fails on the Recovery tab of the service properties. You can create a script that sends an SNMP trap for example or again use the single executable of the monitor product to send alerts.
I decided that Citrix offers better ways to monitor the functionality of the Citrix XenApp services, which I will discuss later on. So we don’t monitor services at this customer.
Event Log
The event log has lots of interesting information for alerting and in the next paragraph you will find out that it offers together with XenApp cool alerting possibilities. However when there is no agent available, we need to find out how we can use the messages available within the eventlog. The solution was much easier than I expected in the beginning, because I was pointed to possibilities which are default available in Windows; sending SNMP traps if a specific event was written to the eventlog. I did not know this feature, but it’s easy, customizable and works with any monitor products that support SNMP traps (and they all do). To arrange this is first to define on which event a trap need to be send. This is done via the utility evntwin, which is available when you installed the SNMP services on your machine. Within this utility you can define a custom Event to Trap translator where you can add the events on which you will send a trap (perform this step on a machine which is fully installed, so all events are available).
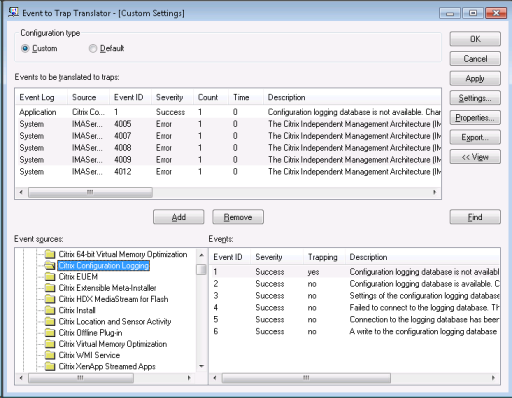
When all the events are selected you export this to a file (logically via the export button). The will produces a .cnf file. This file can be imported on all the servers via the command utility evntcmd. The command is really simple evntcmd <<filename>>.cnf, so this is easy to add to installation scripts or your deployment toolkit.
You probably already understood that we implemented this option for the customer, especially when you read further about monitoring Citrix components.
Citrix Components
Logical on a XenApp server you would like to monitor (and alert if something is wrong) on specific XenApp/RDS components. Logically Citrix promotes EdgeSight, but in infrastructures where already another (heavy) monitor product is available it’s difficult to implement (political, not technical of course). Actually Citrix offers some nice functionality to test if the XenApp server is functional via the Health Monitoring and Recovery settings in Citrix policies.
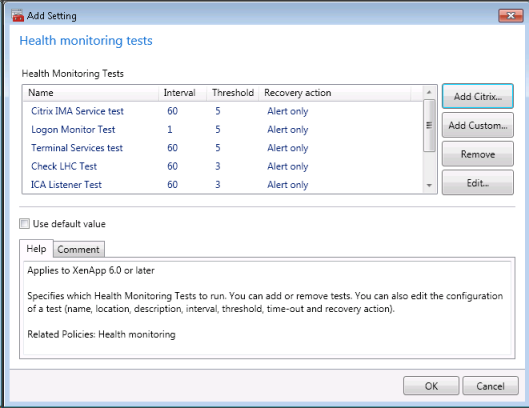
Although I always configure them at a customer, the usage was in my opinion always a bit limited. Most actions you can define as a Recovery actions are dangerous (restarting services or reboot the server), because in my experiences a XenApp Server most time dies slowly (in the beginning of issues connected users can still execute their tasks, while new uses are having issues already) or the alerting was limited. However now we can send SNMP traps on events in the eventlog we can alert on HMR policies by defining the Citrix HMR policy with an recovery action Alert Only (or for some test can also use Prohobit Logons and connections to this server, as this also creates an event in the event log). Those events in the event log can then be added to Event to Trap translator configuration file and send via SNMP to the monitor product.
In my opinion this is creating a real added value by combining the Citrix HMR functionality together with traps of events.
Also the administrators would like be alerted when a certain amount was reached of total users per server, disconnected users per server and if a session is in a sown state. By default you can get those out of performance counters, so we could use the system metrics solution. However we should set-up that way only for these alerts only. So I decided that another way should be developed. With the current version of Citrix XenApp this is pretty easy to accomplish by using some PowerShell commands and forward the result to the monitor product.
Below you will find some example scripts, which I have set-up for these taks.
|
#--------------------------------------------------------------------- # Script: ConnectedUsers.ps1 # Determine amount of connected/idle users and report those higher than defined value # Creator: Wilco van Bragt # Creation Date: 16-10-2013 #---------------------------------------------------------------------
if (Get-PSSnapin Citrix.XenApp.Commands -ea 0) {} else { Add-PSSnapin "Citrix.XenApp.Commands" }
$resultconnected=1
$resultconnected=Get-XASession -Farm | select ServerName | group ServerName | Where-Object -FilterScript {$_.Count -gt 1} | select name,count
foreach ($line in $resultconnected) {##replace below line with your command to report to monitor product write-host Server $line.name has $line.count total sessions, please check the server} |
|
#--------------------------------------------------------------------- # Script: DisconnectedUsers.ps1 # Determine amount of disconnected users and report those higher than defined value # Creator: Wilco van Bragt # Creation Date: 16-10-2013 #---------------------------------------------------------------------
if (Get-PSSnapin Citrix.XenApp.Commands -ea 0) {} else { Add-PSSnapin "Citrix.XenApp.Commands" }
$maxdisconnectedsessions=8
$resultdisconnect=Get-XASession -Farm | Where-Object { $_.State -eq "Disconnected"} | select ServerName | group ServerName | Where-Object -FilterScript {$_.Count -gt $maxdisconnectedsessions} | select name,count
foreach ($line in $resultdisconnect) {##replace below line with your command to report to monitor product write-host Server $line.name has $line.count disconnecteds session, please check the server} |
The last thing we would like to monitor and alert on is the serverload provided by Citrix. For this I also created a small PowerShell script, which can be found below.
|
#--------------------------------------------------------------------- # Script: CitrixServerLoad.ps1 # Determine the load per server # Creator: Wilco van Bragt # Creation Date: 16-10-2013 #---------------------------------------------------------------------
if (Get-PSSnapin Citrix.XenApp.Commands -ea 0) {} else { Add-PSSnapin "Citrix.XenApp.Commands" }
$maxserverload=8000
$serverloadresult=get-xaserverload |select ServerName,Load
foreach ($line in $serverloadresult) { if ($line.Load -gt $maxserverload) { write-host Server $line.servername has a serverload of $line.load, please check the server}
} |
Conclusion
At first when it became clear that the monitor agent could not be added to the PVS base image I thought we got a big issue to monitor the XenApp Session Hosts. At the end I think we got a real nice solution that full fits the needs of the customer and is not that difficult to implement. With some easy scripts, standard Microsoft Windows functionality and SNMP you can create a full monitor solution. Personally the best of this part is that can be re-used/applied to other infrastructures as well.