In this article series I will go into detail about resource usage of PVS servers. In the first part I described the theory values Citrix is using/advising for the components CPU, Memory, Disk and Network. The article series continued with taking a look at the real life resource usage of PVS servers. In this part we will take a look at resource usage of the PVS servers during boot(storm) scenarios.
(Boot) Storm scenarios
Before I’m going into detail into the scenarios I would like to mention that actually these scenarios are the occasion of this article series. At one of my customers questions were asked about the sizing of the PVS servers in the Technical Designs and they would like to know what will happen when a system administrator causes a boot storm. So these scenarios were test in a production environment. Because of that I could only do them once and not like a real scientific research project where those tests are repeated several time to be 100% sure the outcome is correct. So the values don’t guarantee anything and can be (very) different in your environment.
Together with the customer we defined four boot scenarios:
- Standard Reboot Schedule
- 25 Target Devices simultaneously
- One site of the datacenter simultaneously
- Both sites of the datacenter simultaneously
Where the first two scenarios are scenarios which are occurring in practice, the last two are “what if” scenarios. The customer does want to do that cases in the production, but would like to know what happens if someone is (by accident) executing those scenarios. The customer also had several datacenters (both with an active/active site setup) where some datacenters still were running with 1 Gbit core switches and some datacenter were already running 10 Gbit core switches and was also interested if there are differences between those setups. As you will see the PVS server are virtual machine hosted in an ESX infrastructure and the network cards of these VMs are 10 Gbit based. Also the physical machines are blades in stacked enclosures, so the core switch is not used for all network traffic.
The environment
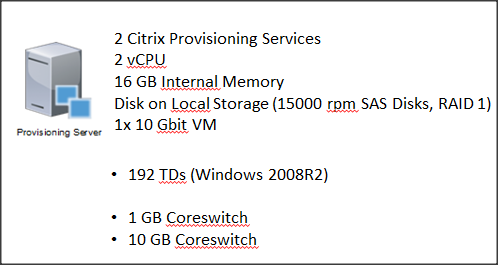
Per datacenter we also have 2 Provisioning Servers (just like the Real Life scenarios discussed in part 2). Those PVS servers have 2 vCPUs, 16 GB Internal Memory and the disks are stored on local 15000 rpm disks of the blade. The virtual NIC is 10Gb, but dependent on which datacenter the physical NIC is connected to an 1 Gb or 10 Gb coreswitch. The tests are executed with a total of 192 Target Devices running Windows 2008R2 with XenApp 6.5.
Standard Reboot Schedule
Let’s start with the first scenario the standard reboot schedule. The XenApp Session Hosts were divided four reboot group, where each groups boots every 48 hours (so two groups a day). Within the reboot group there are 48 servers which are rebooting within a 35 minutes timeframe. To imitate this reboot schedule we started one Target Device every 40 seconds.
As I already described those test were bipartite, besides the resource usage we are also interested of there are a significant differences between a data center with a 1 Gbit or 10 Gbit core switch.
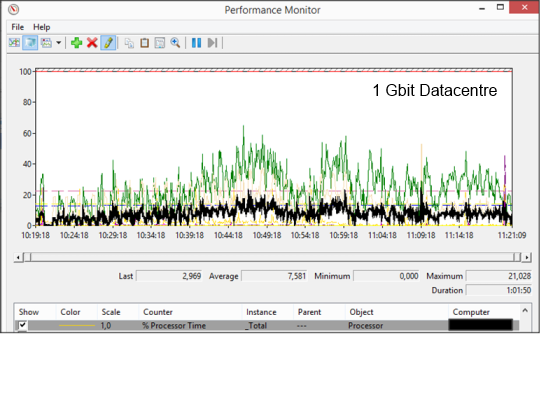
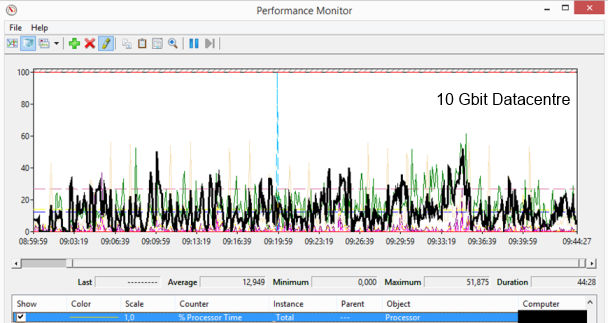
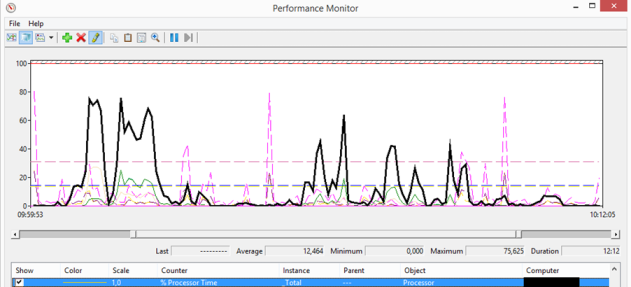
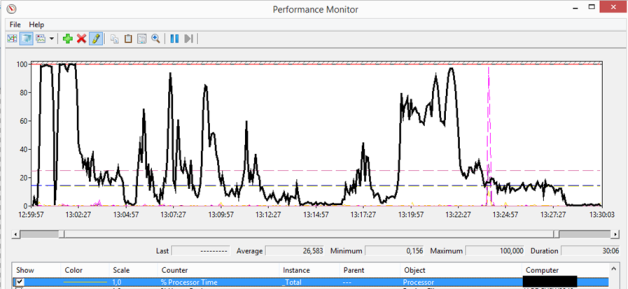
When we take a look at the CPU we see that the CPU usage is different between the two types of data centers. At the 1Gbit data center we see a peak CPU usage around 20%, the maximum CPU usage at the 10Gbit is between 40 and 50%. The average of 1 Gbit is less than a 10 Gbit, however the duration time is longer. We can conclude that the amount of network bandwidth reflects the CPU usage is this scenario.
Just as the daily usage scenarios we did not see any differences in the available memory during this scenario; around 14 GB of memory is available. Also during this scenario we don’t see much disk activity, a peak is monitored of 1,5% Disk Time. Also there is no disk queue length monitored.
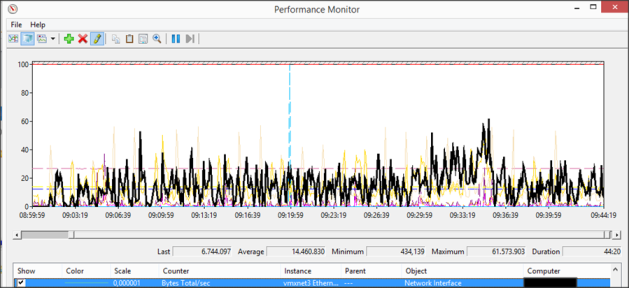
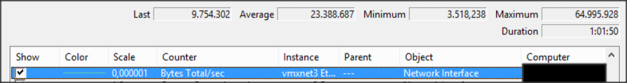
The network shows a bit different view. In some way the 10Gbit network has a bit lower bandwidth usage peak as the 1 GB network 470 Mbit versus 495 Mbit. Also the average is lower on the 10Gbit, but this is caused by the fact that it needs less time to handle the traffic (and we metered within the same timeframe as seen in below figures).
25 Target Devices simultaneously
The amount was chosen during the project phase as the amount that should be started simultaneously without causing any issues within the infrastructure. The test was to check if this assumption was correct.
When starting 25 Target Devices simultaneously the differences between the 1 Gbit and 10 Gbit networks are not that big. The average of the 1 Gbit network is 10%, while a 10Gbit network has an average of 12%. The peaks are pretty similar 70% on a 1 Gbit, while the 10 Gbit network reached 75%. The peaks are for a pretty short time, so would not cause any issues in a production environment.
Both the memory usage as the disk usage shows the same behavior. The amount of available memory stays the same during the test and there is almost no disk activity/disk queue length for both networks.
Starting those machines at once is logically causing a bit more network traffic at the same time. Just as other results of this test scenario the results on the network usage are comparable between the two networks. The 1Gbit network has a peak around 1,5 Gbit and an average of 232 Mbit, while the 10Gbit network peaks at 1,6 Gbit with an average of 245 Mbit. Logically the 10 Gbit network is a bit quicker within the time frame.
Summarization
In this third part of the article series we started looking at boot(storm) scenarios. I described the four scenarios and the environment. Also the results of the first two scenario were discussed. In the last part I will continue with the remaining boot(storm) scenarios and will compare the results of the boot scenarios with the Citrix theory.